In brief
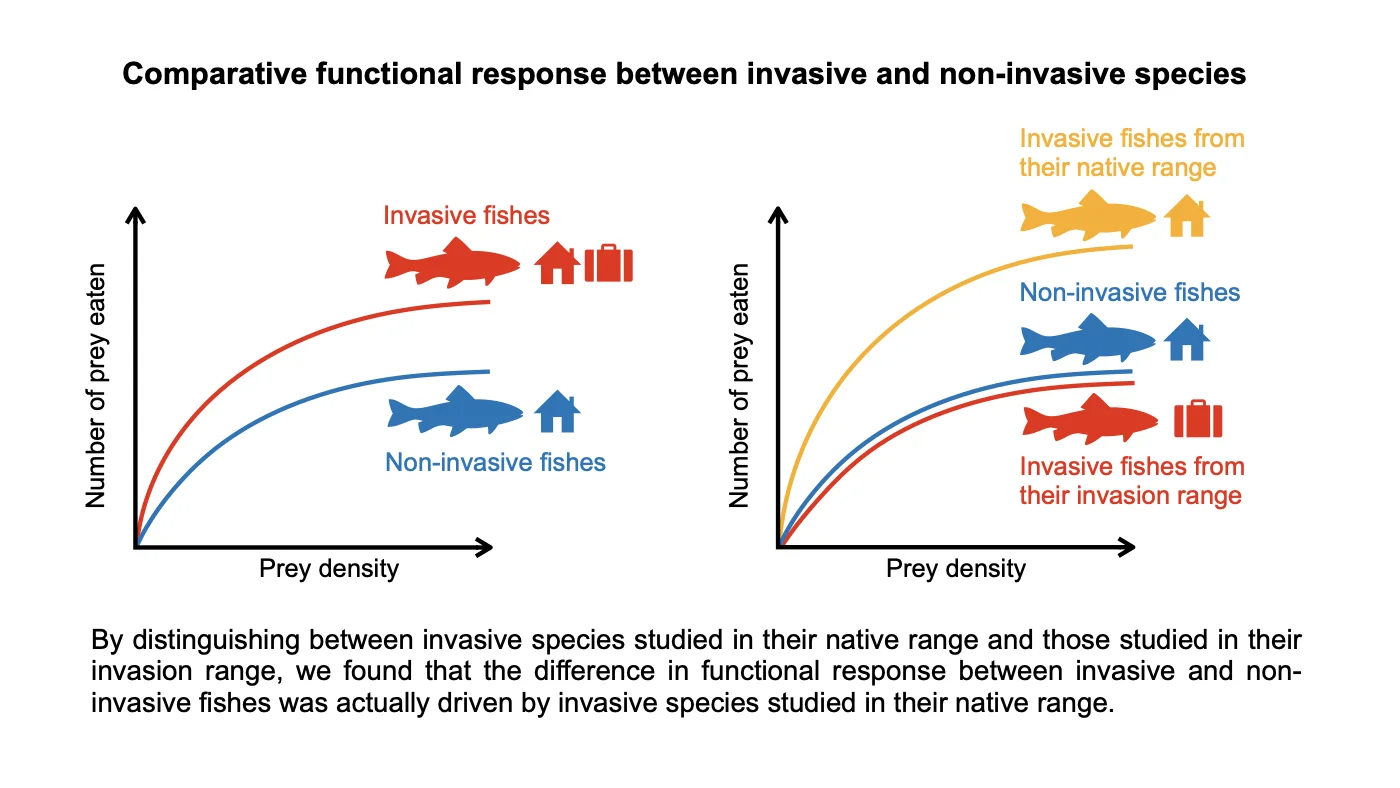
Do invasive species consume more prey? The study gathers 269 functional-response estimates already published for 45 freshwater fish species and compares them statistically. Invasive species have a higher functional response when studied in their native range, but not in the regions where they were introduced: where the measure is taken matters.
Question
Does a species' functional response — the relationship between prey abundance and its consumption — tell us about its invasiveness and its trophic impact?
Approach
A comparative statistical analysis of 269 published estimates (45 freshwater fish species, FoRAGE database), with Bayesian mixed models (MCMCglmm, in R) that account for relatedness between species and for the temperature of the original experiments. No new experiment was run; the data and material are published on Zenodo.
Research area
Cite
Courtois, M. A., Souques, C., Voituron, Y., Teulier, L., Médoc, V., & Dechaume-Moncharmont, F. X. (2026). Functional response predicts invasiveness but not trophic impact. Journal of Animal Ecology, 95(5), 808–823. https://doi.org/10.1111/1365-2656.70232
Show the BibTeX entry
@article{courtois2026functional,
  title = {{Functional response predicts invasiveness but not trophic impact}},
  author = {Courtois, Marine A. and Souques, Chloé and Voituron, Yann and Teulier, Loïc and Médoc, Vincent and Dechaume-Moncharmont, François-Xavier},
  journal = {Journal of Animal Ecology},
  year = {2026},
  volume = {95},
  number = {5},
  pages = {808–823},
  doi = {10.1111/1365-2656.70232},
  url = {https://doi.org/10.1111/1365-2656.70232}
}Discover
Why do some fish species become invasive?
A common hypothesis: invasive species are better predators, able to eat more prey. Experiments measure this through the functional response, the relationship between prey density and what a predator consumes. This study does not repeat those experiments: it compares their published results statistically.
Same number of prey for all three schools
- Non-invasive0
- Invasive · native range0
- Invasive · introduced range0
- Captures per fish per minute, over the last 20 seconds.
Understand
Two parameters, and a question of place.
Two parameters summarise a functional response. The attack rate a measures how efficiently the predator finds prey when prey are rare. The handling time h is the time it needs to capture, handle and digest one prey: it caps consumption.
An invasive species can be studied in its region of origin (native range) or in a region where it was introduced. A measure taken in the native range is often assumed to hold everywhere: this assumption had never been tested.
Search efficiency when prey are scarce: the slope at the origin.
Time spent on each prey: it sets the ceiling 1/h.
Current ceiling: 10 prey per unit of time. A “better” predator has a larger a and a shorter h: its curve rises faster and higher.
- Functional response
- Ceiling 1/h
- Reference (a = 1, h = 0.1)
Arbitrary units: a teaching curve, not a fit to the data.
Go deeper
Model, assumptions, results and limits.
A comparative statistical analysis of 269 published functional responses, gathered in the FoRAGE database, for 45 freshwater fish species (23 non-invasive, 22 invasive). Bayesian mixed models (MCMCglmm, in R) account for relatedness between species (phylogenetic correction) and for the temperature of the experiments.
Assumptions
- Invasive species are split according to whether they were studied in their native range or in their introduced range.
- The temperature at which each original experiment was run is taken into account.
Published results
- Invasive species have a higher functional response than non-invasive species, but only when they are studied in their native range.
- Studied in their introduced range, they have attack rates and handling times comparable to those of non-invasive species.
- The attack rate decreases with temperature in non-invasive species and tends to increase in invasive species studied in their introduced range: climate warming could widen the competitive gap between them.
- A high functional response predisposes a species to invasiveness, but a measure taken in the native range does not predict trophic impact elsewhere.
Limits
- The study compiles functional responses that were already published: it relies on no new experiment.
- It covers freshwater fish.