Skip to content
MC

ProjectData analysis

Functional responses of freshwater fish

269 functional responses, 45 species: what prey consumption says, and does not say, about invasiveness.
Published All projects

Aim

Check whether a common measure of a predator's voracity, the functional response, really sets invasive fish apart from the others, taking into account where each species was studied.

Scientific value

The study range changes the comparison: a measurement taken in a species' native range does not necessarily hold in its introduced range. This result rests on 269 functional responses from 45 species, analysed while accounting for their relatedness.

Context

The functional response links a predator's consumption to the density of its prey. It is often measured to compare invasive and non-invasive species, on the assumption that a measurement taken in the native range holds everywhere.

Question

Do functional-response parameters differ between an invasive species studied in its native range and the same species studied in its introduced range?

Results shown

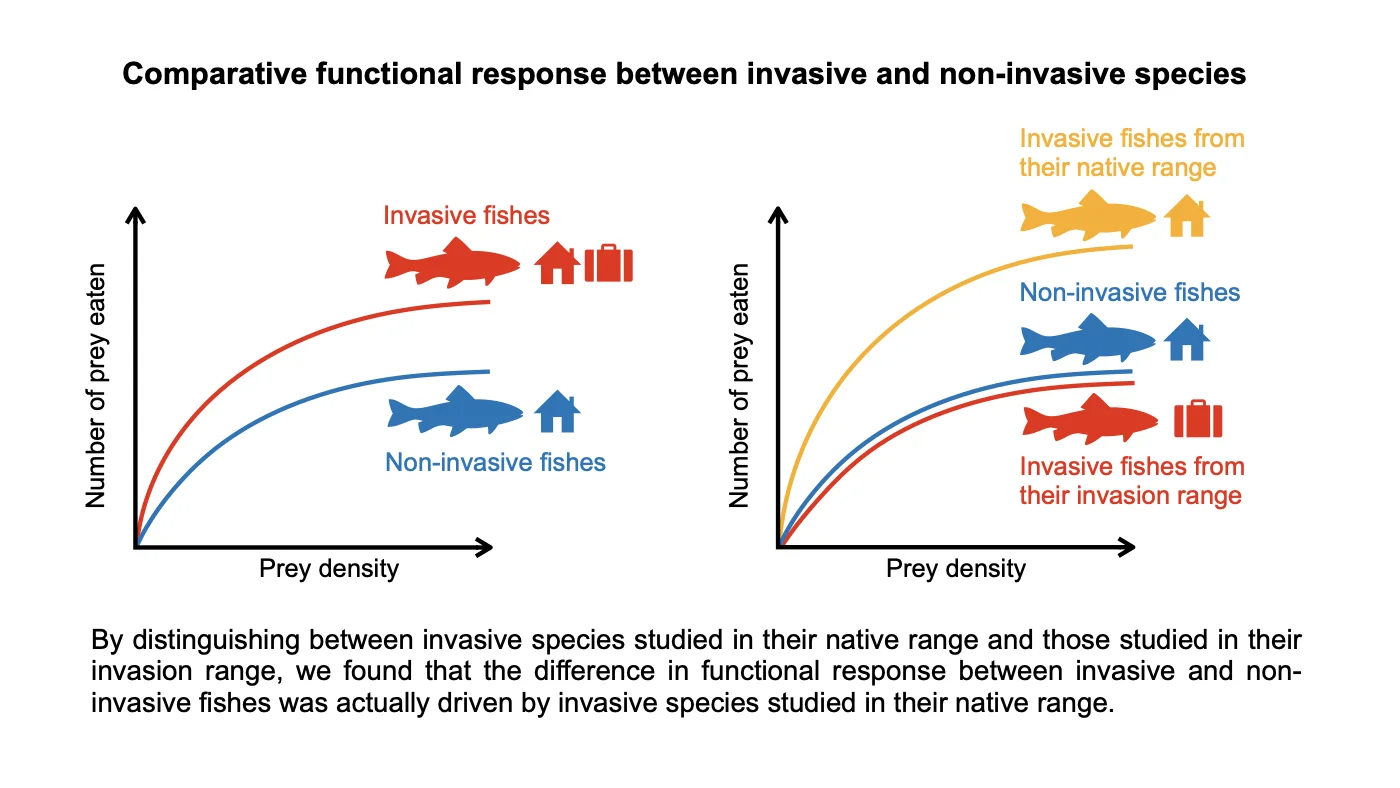
  • Invasive species show a higher functional response than non-invasive ones, but only when studied in their native range.
  • Studied in their introduced range, they have attack rates and handling times comparable to non-invasive species.
  • The attack rate decreases with temperature in non-invasive species and tends to increase in invasive species from the introduced range.

Limitations

  • The data come from published experiments with heterogeneous protocols.
  • The charts on this site show the raw data; the article's conclusions rest on phylogenetically corrected models.

Explore the data

Illustration — simulated behaviour, not measured
30

Same number of prey for all three schools

  • Non-invasive0
  • Invasive · native range0
  • Invasive · introduced range0
  • Captures per fish per minute, over the last 20 seconds.
Each fish spots a prey within its search radius, chases it, then stops for as long as it takes to handle it (1.3 s / 0.8 s / 1.3 s). When prey are plentiful, this handling time caps the captures. The order of the schools follows the article's result; the values are illustrative.
Attack rate a of the 269 estimates, by group, on a logarithmic scale.Non-invasive species · 101 estimatesInvasive, studied in their native range · 107 estimatesInvasive, studied in their introduced range · 61 estimates10⁻⁴10⁻²10⁰10²10⁴m³ per predator per day — logarithmic scale; black line: group median
Raw data from the Zenodo repository (CC BY 4.0), same selection as the article: 269 estimates, 45 species. The published conclusions rest on Bayesian models corrected for phylogeny and temperature (MCMCglmm), which this plot does not replace.

Figures and media

Graphical abstract of the article: on the left, invasive fish consume more than non-invasive ones; on the right, once the study range is separated, only invasive species studied in their native range stand out, those studied in their introduced range joining the non-invasive ones.
Graphical abstract of the study: the difference in functional response comes from invasive species studied in their native range.Courtois et al. 2026, Journal of Animal Ecology — Zenodo 10.5281/zenodo.18377688, CC BY 4.0

Code, articles and resources