Skip to content
MC

ProjectTool and visualisation

The thesis figures, reproducible

Eleven Jupyter notebooks sorted by chapter: every figure of the thesis can be rebuilt from its code.
Published All projects

Aim

Let anyone reading the thesis redo each figure from the code, chapter by chapter.

Scientific value

The figures become checkable: one can inspect the parameters used, rerun the computations and compare the result with the figure in the thesis.

Context

A thesis gathers dozens of figures produced by different models. The thesisData repository makes them checkable and reusable.

Question

How can a reader redo each figure, from the model to the chart?

Results shown

  • The figures of chapters 1 to 5 are reproduced by public notebooks, with the library versions stated.

Limitations

  • The notebooks reproduce the figures; they are not a software library reusable as is.

Figures and media
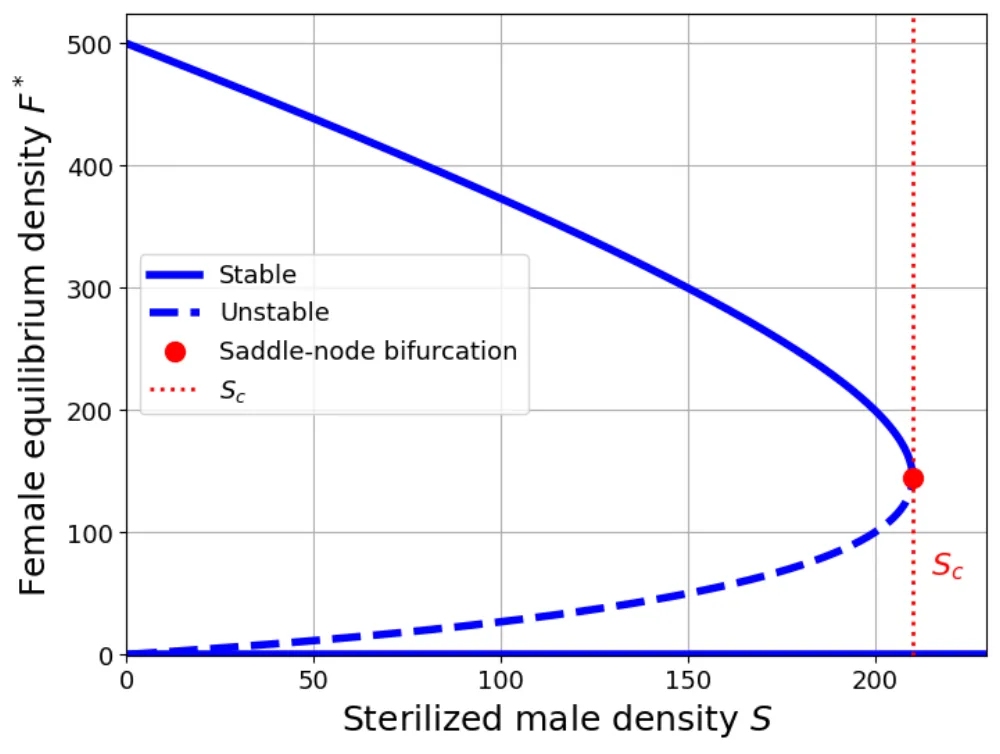
Bifurcation diagram: equilibrium density of females as a function of the density of sterilised males, with a stable branch, an unstable branch and a saddle-node bifurcation point at S_c.
Bifurcation diagram of a model with competition and sterile releases: beyond S_c, only the zero equilibrium remains.thesisData — Chapter 2 - Modeling SIT/fig_chapter2_thesis.ipynb
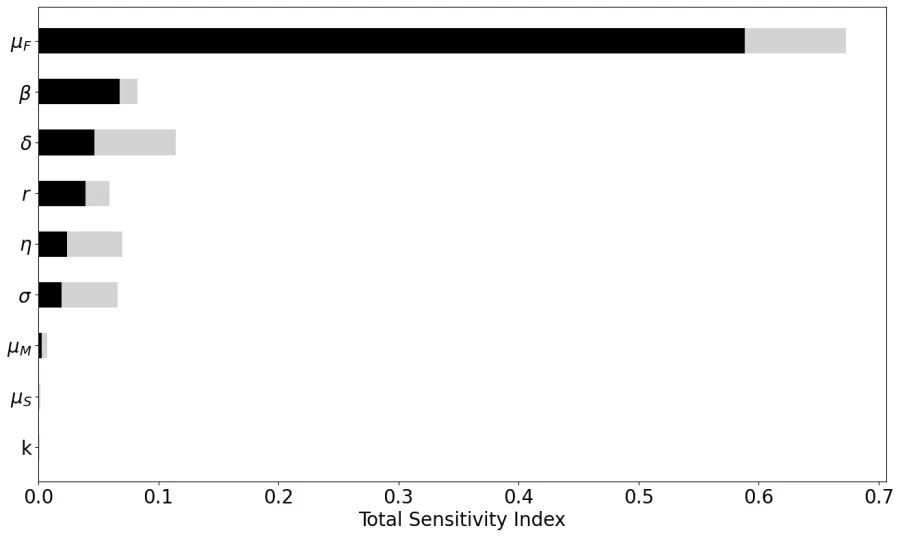
Horizontal bar chart of the total sensitivity indices of the model parameters; μF has the highest index.
Sensitivity indices of the parameters of the residual-fertility model.thesisData — Chapter 3 - Residual Fertility/Sensitivity_Analysis_SIT.ipynb
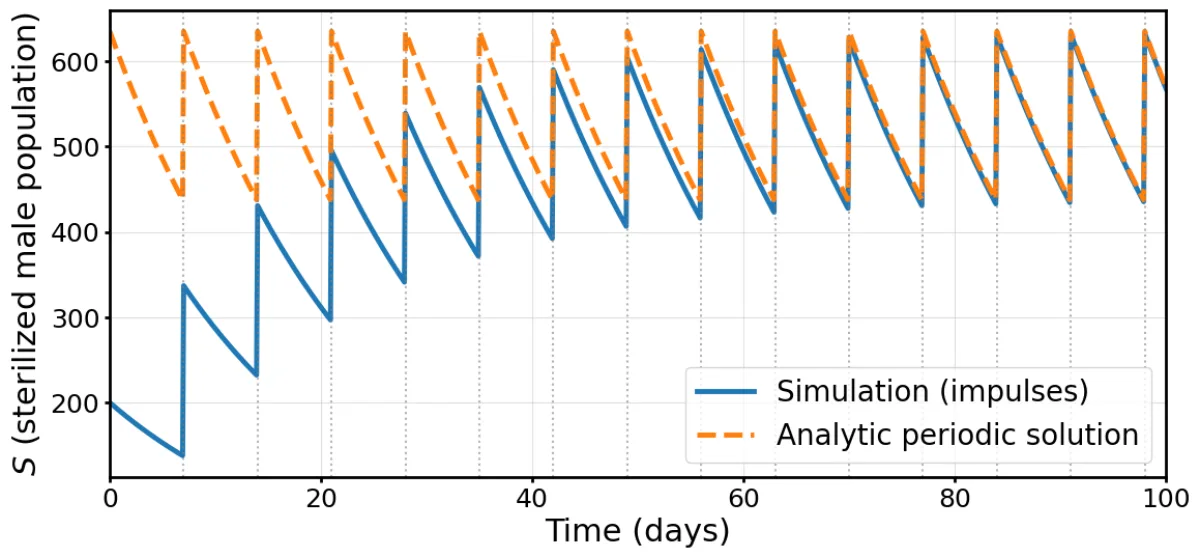
Population of sterilised males under periodic releases every 7 days: the simulation converges to the analytical periodic solution.
Impulsive releases: the sterile male population converges to a periodic solution.thesisData — Chapter 5 - Agricultural Context/Notebook_part_impulsive_releases.ipynb

Code, articles and resources